
The light our eyes receive from the environment influences us in many ways. Perhaps most obviously, it allows us to see and interact with objects and find our way around the world. But it also has important consequences for our health, mood and choices: Standing under a bright blue sky in a green meadow, our mood and behaviour are likely to be very different than when we are in the dim indoor light of a grey office building on a cloudy day. The same is true for animals: they need to constantly choose where to be and what to do, and the pattern of background light contains a lot of information to help them with this choice.
Considering this important function of light, we have surprisingly little structured knowledge of how the light pattern differs between different environments, at different times of day and year, and under different weather conditions. In collaboration with Dan-Eric Nilsson of Lund University, we have developed the ELF analysis tool and plot standard as a biologically relevant new way to measure light distribution in natural and human-built environments.
The ELF method
The method we use to characterise visual environments is simple to understand and perform: We take a number of carefully leveled photographs (usually between 20 and 40) with a calibrated digital camera at randomly or strategically selected locations in an environment of interest.
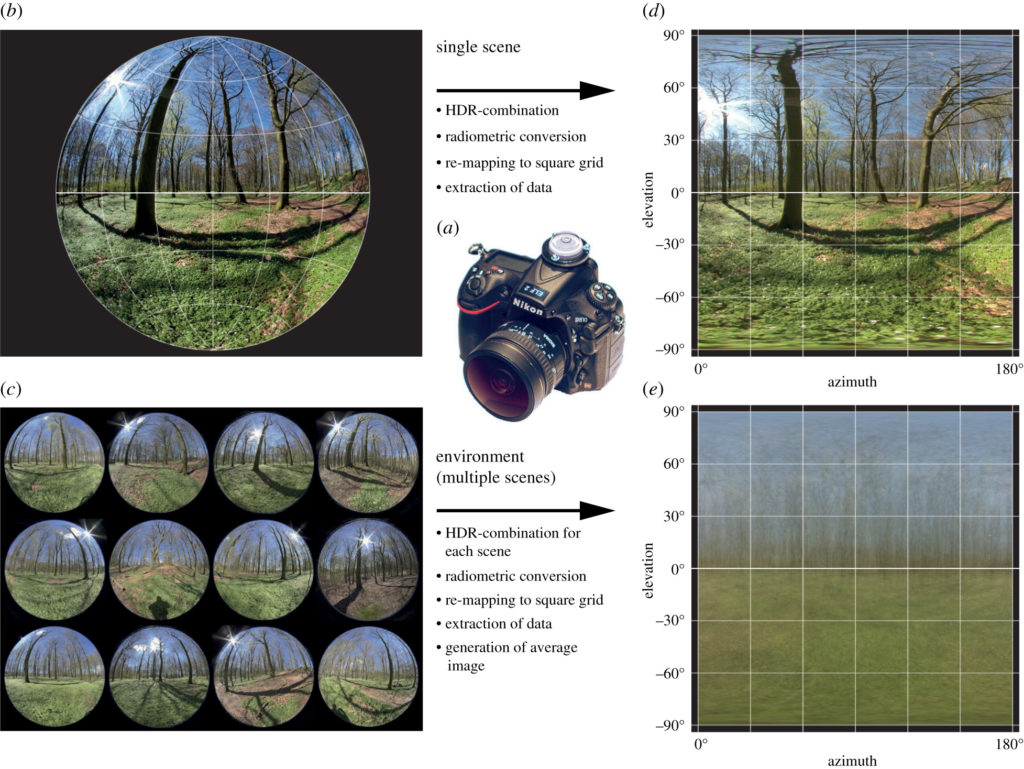
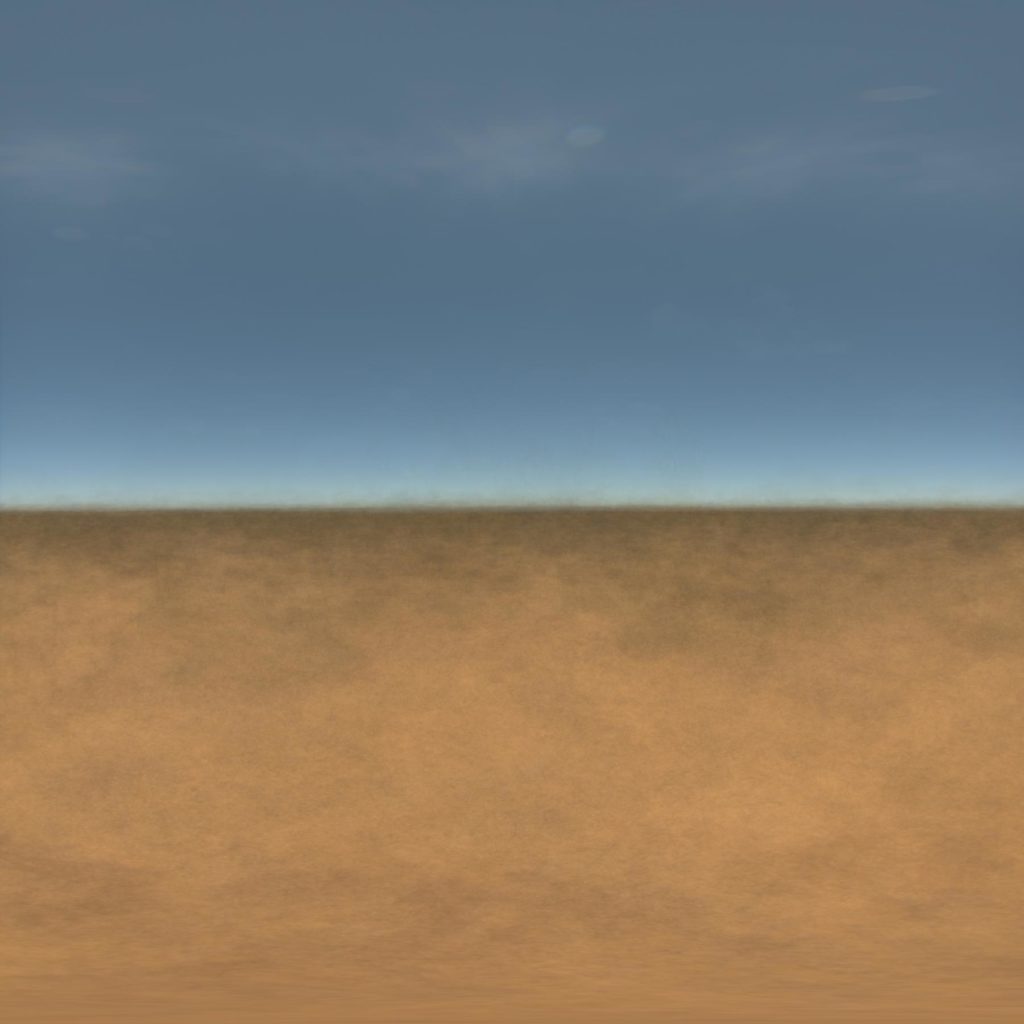
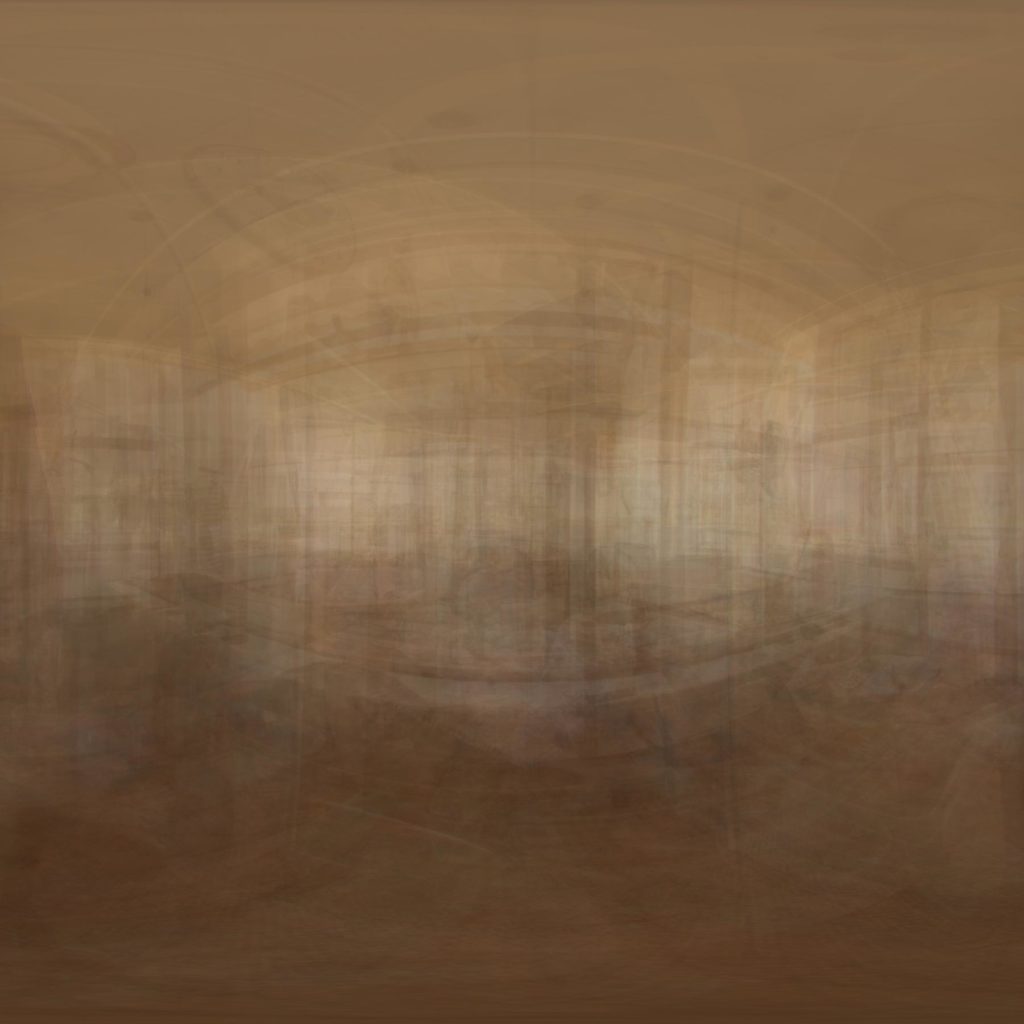
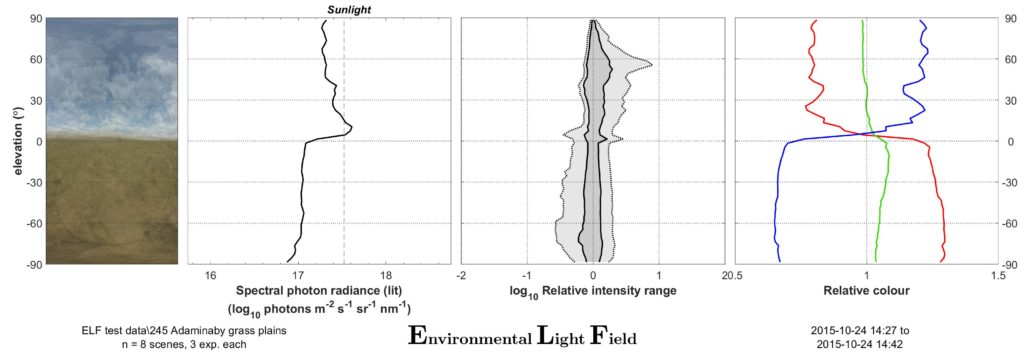
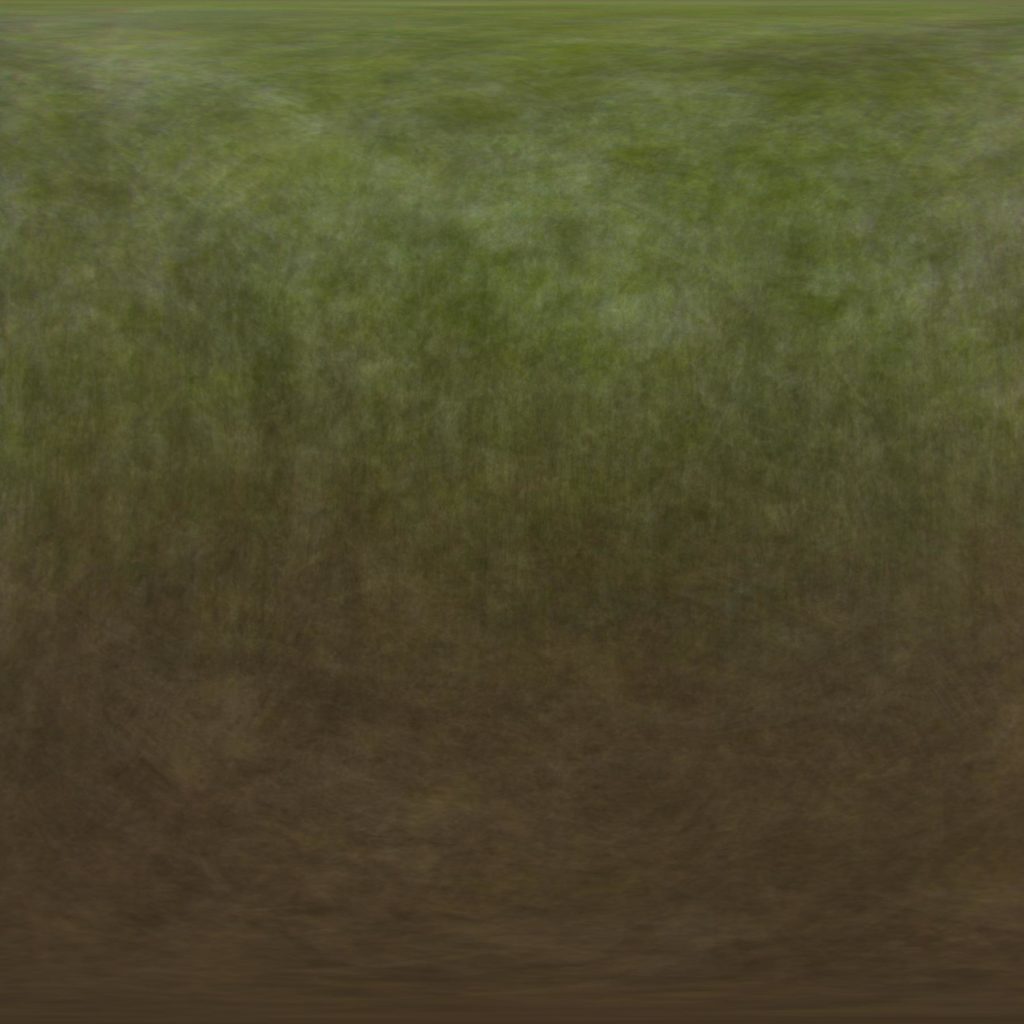
These photographs are then analysed with our Matlab software to provide two main outcomes: a mean image, and an ELF plot sheet with graphs showing the environment’s average vertical light gradients for intensity, contrast and colour information. The mean images (apart from often being very artistically pleasing) provide a quick visual overview of the environment, and particularly show off the typical colour and intensity changes along elevation. The three simple plots show what, in our almost 10-year experience of sampling environments in this manner, is the simplest way to characterise the main biologically relevant visual differences between environments. If you are interested in the method, have a look at the original paper describing it (Nilsson & Smolka 2021) or contact us; we are happy to help with your next project using ELF!
The ELF software
The software to analyse ELF data sets is freely available for personal and educational/research use as a Matlab package on our github page at https://github.com/sciencedjinn/elf. If you are familiar with git, check out the version you need and stay up-to-date easily. If you are unfamiliar with git, you can simply download the version you need as a zip below. The most recent version can always be found in the master branch (download zip). This version is internally tested but, inevitably, there will sometimes be bugs when a new version is released. In this case, if you need to return to the last stable version of ELF, you can find it in the laststable branch (download zip).
ELF works on Windows and MacOS, and requires a current version of Matlab with the Statistics Toolbox and the Image Processing Toolbox installed. You also need the free Adobe DNG Converter to convert your raw NEF files to the Adobe DNG format. (We are hoping to eventually provide a version that works without Matlab – if this is important to you, consider hiring us to develop it 🙂 !)
The software installation includes a manual and an easy-to-use graphical user interface. We have included simple routines to
- automatically detect bracketing or to provide a manual bracketing configuration file (if you manually changed exposures rather than using the camera’s bracketing function; or if, for whatever reason, you want to combine images differently)
- use dark images to remove high noise in low-light images
- bulk-process arbitrarily large numbers of data sets
- warn of possible problems with your data sets
- save the ELF vertical light gradients as jpgs, editable pdfs and in numerical form as CSV or XLSX files
More functionality is always in the works, but if there is a particular function you need, contact us and we will be happy to discuss your development needs.
Calibration reports
If you are interested in the details of how we calibrated our cameras, and how accurate our photon flux estimates are, follow these links to download the full methods and results of our calibration measurements:
Nikon D810 with Sigma 8mm F3.5 EX DG fisheye lens (from Nilsson & Smolka 2021 / CC BY 4.0)
Nikon D850 with Sigma 8mm F3.5 EX DG fisheye lens
Studies using ELF
In the 10 years since Dan-Eric Nilsson and ScienceDjinn began developing ELF, we have sampled hundreds of environments, many at different times of day, different seasons, and in different weather. Here are a number of published studies that have used ELF data:
Nilsson et al. (2022) – A broad overview of how vertical light gradients change with different habitat types (terrestrial and aquatic), time of day, season and weather
Mäthger et al. (2022) – A study of pupil dynamics in skates that uses ELF to design naturalistic laboratory stimuli
Warrant et al. (2020) – Using ELF to summarise the structure and distribution of light in natural scenes
Bergman et al. (2021) – A study of perching behaviour of butterflies, using ELF to compare the views in chosen versus rejected perching sites
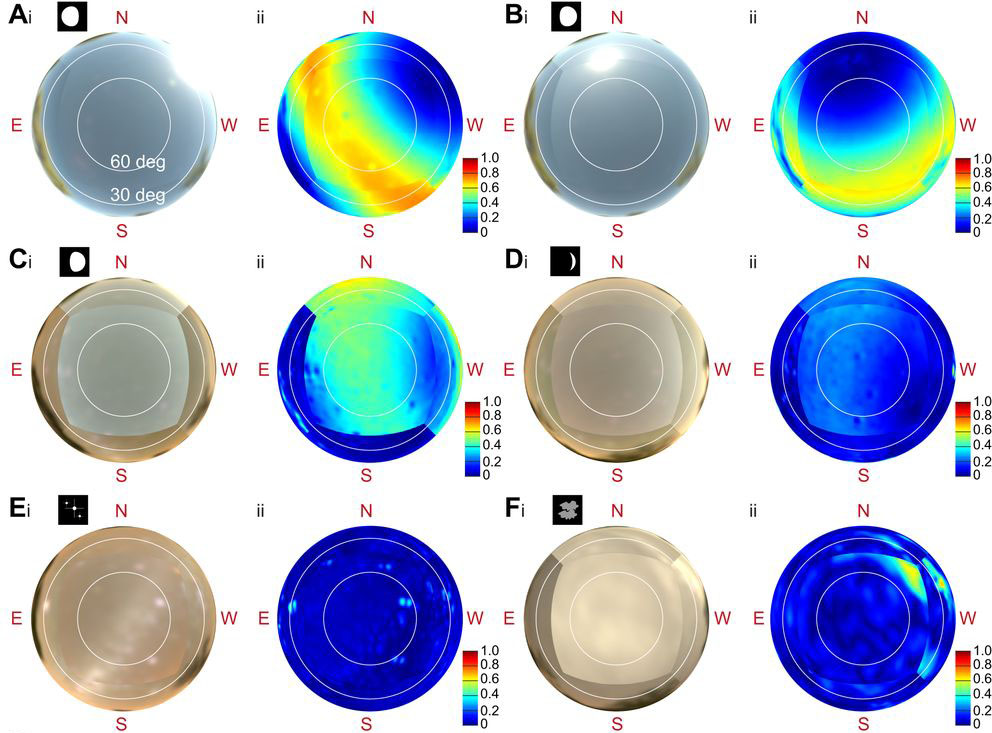
The photometric calibration we performed for our camera/lens combinations can also be used to obtain calibrated natural images under difficult conditions, e.g. to model navigation by the starry sky (Foster et al., 2017, 2018) or the lunar polarisation pattern (Foster et al., 2019), or to investigate nocturnal light pollution (Foster et al., 2021). It can also be used to obtain naturalistic images to calculate image statistics in a study animal’s natural habitat (Stöckl et al., 2017).
References
The original ELF paper
Nilsson D.-E. & Smolka J. (2021) Quantifying biologically essential aspects of environmental light. J. R. Soc. Interface 18: 20210184.20210184 (open access)
Studies using ELF
Nilsson D.-E., Smolka J. & Bok M. J. (2022) The vertical light-gradient and its potential impact on animal distribution and behaviour. Front. Ecol. Evol. 10: 951328 (open access)
Mäthger L. M., Bok M. J., Liebich J., Sicius L. & Nilsson D.-E. (2022) Pupil dilation and constriction in the skate Leucoraja erinacea in a simulated natural light field. J. Exp. Biol. 225: jeb243221 (doi, researchgate)
Bergman M., Smolka J., Nilsson D.-E. & Kelber A. (2021) Seeing the world through the eyes of a butterfly: visual ecology of the territorial males of Pararge aegeria (Lepidoptera: Nymphalidae). J. Comp. Physiol. A 207: 701-713 (open access)
Warrant E., Johnsen S. & Nilsson D.-E. (2020) Light and visual environments. In: The Senses: A Comprehensive Reference (Second Edition), Elsevier, pp. 4-30 (doi, researchgate)
Studies using our photometric calibrations

Foster J. J., Tocco C., Smolka J., Khaldy L., Baird E., Byrne M. J., Nilsson D.-E. & Dacke M. (2021) Light pollution forces a change in dung beetle orientation behaviour. Curr. Biol. 31: 3935-3942.e3 (open access)
Foster J. J., Kirwan J. D., el Jundi B., Smolka J., Khaldy L., Baird E., Byrne M. J., Nilsson D.-E., Johnsen S. & Dacke M. (2019) Orienting to polarized light at night – matching lunar skylight to performance in a nocturnal beetle. J. Exp. Biol. 222: jeb188532 (open access)
Foster J. J., Smolka J., Nilsson D.-E. & Dacke M. (2018) How animals follow the stars. Proc. R. Soc. B 285: 20172322 (open access)
Foster J.J., el Jundi B., Smolka J., Khaldy L., Nilsson D.-E., Byrne M.J. & Dacke M. (2017) Stellar performance: mechanisms underlying Milky Way orientation in dung beetles. Phil. Trans. R. Soc. B 372:20160079 (open access)
Stöckl A., Smolka J., O’Carroll D. & Warrant E. (2017) Resolving the trade-off between visual sensitivity and spatial acuity—lessons from hawkmoths. Integr. Comp. Biol. 57: 1093–1103 (open access)